Sentiment Classification
Sentiment Classification
The key step to answer our research questions is to detect the sentiment expressed in each one of the quotations, that is, we need to perform a Sentiment Analysis task. To do so, we had the choice between pretrained supervised models (BERT), unsupervised models (VADER), or Zero-Shot NLP model. The following table summarizes our thought process.
| Model | Pros | Cons |
|---|---|---|
| Pre-trained BERT | State-of-the-art sentiment analysis results | Without fine-tuning the performance on sample sentences was unsatisfactory and fine-tuning requires labeled data |
| Unsupervised VADER | Does not require any labeled data | The performance on sample sentences was unsatisfactory |
| Zero-Shot Classifier | Does not require labeled data for fine-tuning and predicted reasonable sentiments on sample sentences | Heavier to run |
Given the above pros and cons in the end we decided to use the later model, i.e., the pretrained Zero-Shot Classifier. If you want to replicate the results, keep in mind that the sentiment classification took around 20 hours on a ryzen 5900 with an RTX 3060Ti graphics card, that is, around 40 quotations per second.
Are “Trump” and “American” negative words?
In order to check if the sentiment classification worked as expected, we study the most common words that are not stopwords for each category, i.e., positive, negative, and neutral. We visualize the results in the next Figure. It can be noticed that certain words, e.g. market and company, are common to all categories because in general relevant in finance; instead semantic-carrying words belong to the correct semantic class most of the times. For example, good is quite often present in quotations categorized as positive while difficult and crisis can be often found among the negative class of quotations. Nevertheless, it should be kept in mind throughout the project that the sentiment categories are the result of an (unsupervised) algorithm, meaning that they should be considered with caution.

Generated WordClouds: left positive, middle negative, and right neutral
Keeping in mind the limitations of the sentiment detected, there are still some interesting observations that can be made:
- The word “technology” appears very frequently among the class of positive quotes, which is in agreement with the growth of the so called “Big Tech” companies in the past years.
- It is also quite surprising to see that among the most common words within negative sentences there are the words “American” and “Trump”, and these words are not present at all in the WordCloud representing the positive sentiment. The fact that the selected quotations cover the 2 years before the elections and the first 3 full years of Trump’s Presidency might indicate a general discontent towards the economic ideologies or policies proposed by Trump.
If you are down for a little “Finding-the-words game”, you can try to find the words mentioned above, otherwise you can scroll down at the end of this page for the solutions. Good luck 🤣
When were we happy about our economy?
The sentiment expressed in the news is an extremely useful tool to detect how the financial sector and the overall economical stability are perceived at a certain point in time. In this section we analyze the overall sentiment expressed within all the over 3 million quotations to see if the time series of the sentiment displays regularities that can be associated with known financial events.
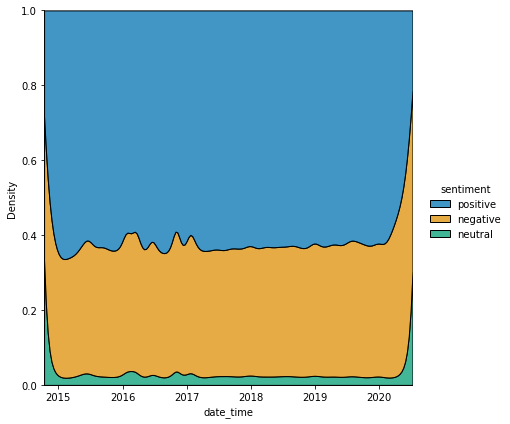
First, the plot above shows the percentage of quotations that are detected as positive, negative, or neutral, for each day from January 2015 until March 2020. From the plot we can conclude the following:
- On average, the positive sentiment is prevalent in this time period with about 60% of the daily quotations carrying a rather positive sentiment. This is in agreement with the overall positive trend the economy has been following in the past years until the Covid-19 pandemic.
- The percentage distribution showed more variability between the years 2015 and 2017. The percentage of quotes carrying a rather negative sentiment increased in mid 2015, beginning of 2016, end of 2016. Interestingly, these periods correspond to the Chinese stock market crash, the announcement of Brexit in the UK , and the election of Donal Trump as President, respectively.
- The following year 2017 sees a rather stable distribution of the sentiment which is in line with the fact that these were considered to be among the years with the lowest financial volatility in history.
- The same stability can be found for years 2018 and 2019, which is quite surprising considering that in these months we have witnessed the US-China Trade war as well as the withdrawal of the US from the multinational nuclear deal which led to political instability in the Middle East throughout the following years.
- Finally, the graph displays a clear reduction in positive quotations at the beginnig of year 2020 which corresponds to the beginning of the, still ongoing, coronavirus pandemic.
We also analyzed how the average sentiment expressed in financial quotes developed over time in the past years. The plots presented here show for each year, starting from 2015 until 2020, the average financial sentiment. Similar conclusions can be drawn as before, but here it becomes even clearer the larger sentiment variability characterizing the end of 2015 and the full year of 2016.
Solutions Finding-the-words game

Generated WordClouds: left positve, middle negative, and right neutral